Who Actually Profits When You Trade On Chatroom Rumours Instead Of Brutal Mathematical Proof?
PUBLISHED PROTOCOL
June 3, 2026
Pukka Sam
Author

Once an investor establishes a secure harbour where capital is shielded from accidental destruction, the nature of the challenge changes entirely. Operating inside a protected simulated environment is merely the initial step. The true test of longevity on the Nairobi Securities Exchange lies in how decisions are made within that space. Moving beyond the baseline mechanics of trade execution means confronting a secondary, more insidious obstacle, which is the widespread reliance on emotional guesswork, chatroom rumours, and unweighted speculation. When cold data is replaced by social noise, the stock market naturally morphs into a digital casino. Retail investors frequently allocate capital to an equity based on a vague tip, completely unaware of the structural undercurrents shaping its actual movement. To escape this cycle of guessing, an investor requires tools that elevate analysis from hopeful projection to statistical probability.
A primary pillar of this analytical transition is the implementation of a Monte Carlo simulation as a dedicated risk forecaster. Instead of attempting to predict an exact future price, which remains a mathematical impossibility, this system executes ten thousand distinct price paths for the next thirty days based entirely on the historical volatility and structural drift of the asset. The result is a comprehensive probability cone that maps out exactly where prices are likely to land with ninety percent confidence. By analysing the exchange through this probabilistic lens, you no longer pray for a specific bullish outcome. Instead, you visually inspect the entire spectrum of risk, understanding precisely what a worst-case scenario looks like before exposing a single shilling of capital.
This broad view of probability becomes significantly more powerful when assets are evaluated side by side to optimize portfolio construction. Through advanced stock comparison frameworks, investors can dissect two to four equities simultaneously on a single unified interface. Rather than switching between isolated screens and disjointed charts, you analyse normalized performance trends and relative strength indicators across a single timeline. This evaluation achieves deeper clarity through an immersive three-dimensional path visualization mode. By rendering the thirty-day performance trajectory of each stock as a distinct pathway in three-dimensional space, you can zoom, rotate, and inspect precise crossover points and historical divergences from multiple analytical angles.
This comparative logic scales upward seamlessly into sector comparison. Individual corporate strength is vital, but equities do not exist in a vacuum. They are bound to the broader macroeconomic currents of their respective industries. Evaluating how the banking counter performs relative to manufacturing, agricultural, or energy sectors allows an investor to position capital ahead of major institutional shifts, ensuring that money flows toward underlying economic strength rather than historical sentiment or emotional attachments.
However, true portfolio resilience requires looking beneath the surface of generic asset scattering to confront the hidden danger of resonance risk. Many retail traders believe they are safe simply because they own five or six different companies. But if those businesses respond identically to the exact same macroeconomic shocks, such as interest rate adjustments, inflationary pressures, or currency fluctuations, the perceived diversification is a dangerous illusion. This overlapping vulnerability is the core of resonance risk. When a market shock occurs, these highly correlated assets vibrate at the exact same frequency, causing the entire portfolio to experience a simultaneous collapse. Identifying this hidden systemic overlap ensures you build true balance, selecting assets that actively counterbalance one another during times of market stress.
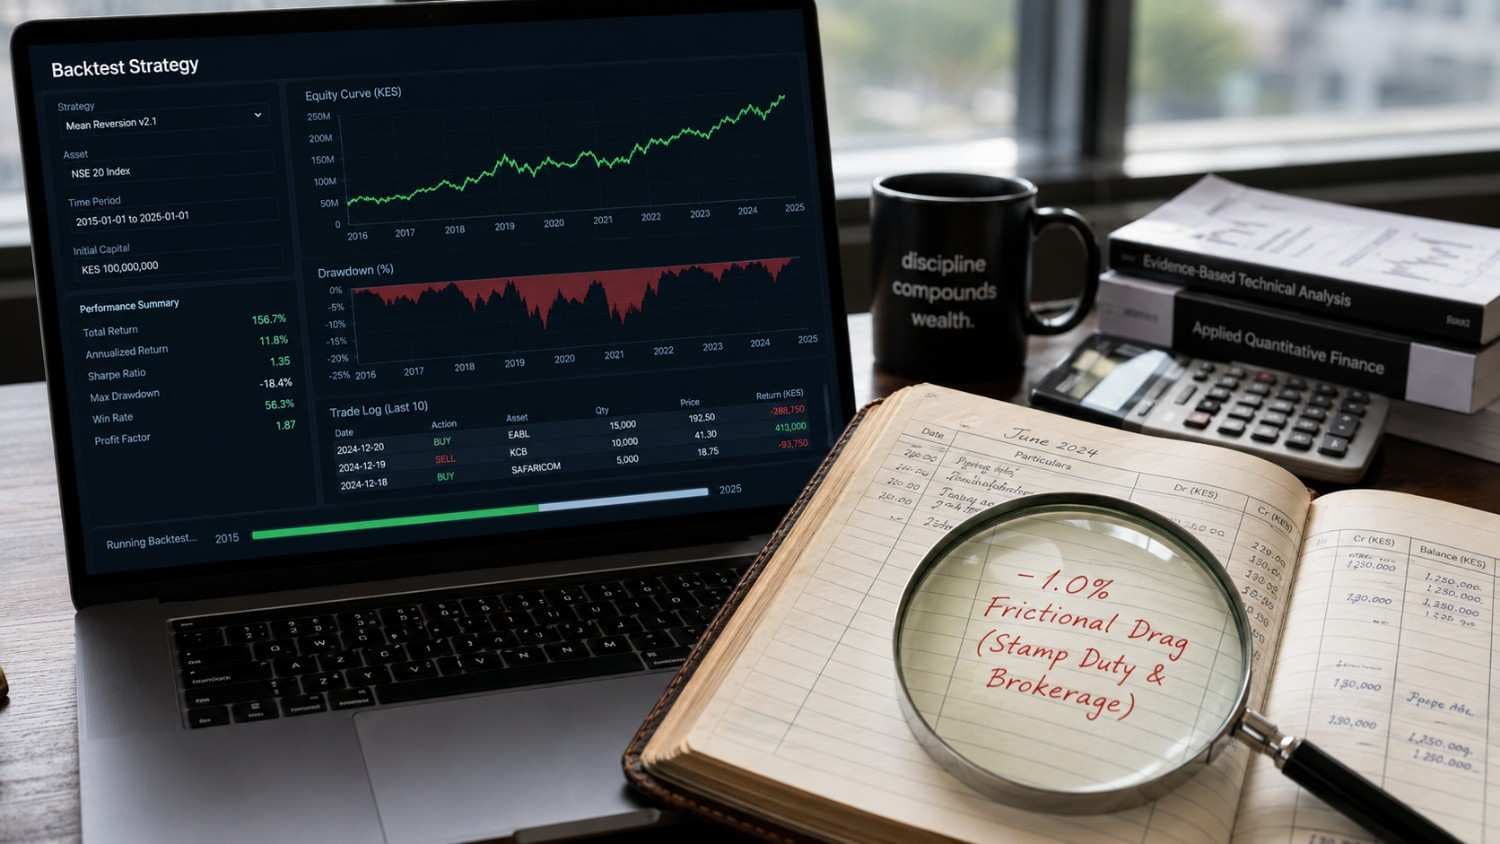
The ultimate validation of these combined quantitative insights happens through a rigorous back test strategy. Before any trading methodology is adopted in the real world, it must be put through the historical fire. The system allows you to run your specific investment rules backward through time against actual historical telemetry to see exactly how your strategy would have performed during past market cycles. To keep these historical results brutally honest, the simulation incorporates a simulated one percent transaction fee that accounts for both stamp duty and broker commissions. This structural friction prevents the common pitfall of over trading, proving mathematically that high frequency execution often eats away your net profits through silent frictional costs. By fusing side by side market comparisons, resonance risk tracking, and historical back testing with probabilistic forecasting, the trading process transitions from a game of chance into a disciplined science.
Through these fused technical dimensions, the process of selecting equities evolves from a game of emotional guesswork into a precise discipline of risk management. You are no longer praying for a favourable outcome. You are executing a quantified strategy backed by historical validation, macro sector alignment, and strict probabilistic math.
Welcome to the Urim Trader Community. Join the official Urim Trader WhatsApp community to connect with other investors share your practice strategies and get daily market insights.
You can now also download the Urim Trader Android app directly from the website
Related Journals

What are your thoughts?
Enjoyed this analysis?
Join other traders mastering the NSE with Urim.